Showing posts with label maps. Show all posts
Showing posts with label maps. Show all posts
Friday, July 1, 2011
Explore Global Warming and Climate Shift Hot Spots Around the Globe
Climate Hot Map lets you explore and investigate global warming and climate change hot spots around the globe. Explore Climate Change Hot Spots Now.
Saturday, June 19, 2010
Climate Change Global Warming Shapefiles - Changes in Temperature and Precipitation from 2010 through 2099
IPCC 4th Assessment scenario A2 temperature and precipitation GIS shapefile map layers for the years 2010, 2020, 2030, 2040, 2050, 2060, 2070, 2080, 2090 and 2099. The data points are spaced approximately 4.5 km (2.8 miles) apart. The data covers the lower 48 United States. Each point includes data for each of the 12 months of the year, making comparisons and calculations of increases or decreases between months and decades possible.
About the A2 Scenario
The A2 storyline and scenario family describes a very differentiated and heterogeneous world. The underlying theme is self-reliance and preservation of local identities. Emphasis on economic, social, and cultural interactions between regions is less than in other storylines. Fertility patterns across regions converge very slowly, which results in high population growth. Economic development is uneven, the income gap between now-industrialized and developing parts of the world does not narrow, and per capita economic growth and technological change are more fragmented and slower than in other storylines. Main characteristics A2 scenario include: high population growth, medium GDP growth, high energy use, medium-high land use changes, low resource (mainly oil and gas) availability, slow pace and direction of technological change favoring regional economic development.
In addition to each GIS shapefile map layer, you get base map layers including cities, roads, rivers, states and water bodies.
Download Climate Change GIS Shapefile Map Layers for Temperature and Precipitation Change from 2010 through 2099
Wednesday, January 27, 2010
Free Renewable Energy Maps and GIS Shapefiles
A major way of reducing CO2 is moving our electric power production away from fossil fuels and towards alternative renewable sources of energy. I've collected some maps and GIS shapefiles related to renewable energy production and potential sites.
Renewable energy potential maps show fuelwood harvested, solar radiation, wind resources and geothermal potential for regions of the U.S.
Renewable energy ArcGIS shapefiles U.S. Biomass Potential: Wind Density and Speed, Hydrogen Potential, Electric Transmission, and Solar Potential for the U.S. Also, International Wind Density and Speed. These are in GIS format. If you are new to GIS check out this introduction. You can make maps yourself using this data and free GIS software - learn with this free tutorial.
Renewable Energy Atlas of the West: A Guide to the Region's Resource Potential - The Renewable Energy Atlas of the West is designed as a resource for policy makers, advocates, landowners, developers and others interested in furthering the production of electricity from renewable wind, solar, geothermal and biomass energy resources. Utilizing state-of-the-art GIS technology.
Maps by country of power resources, minerals, metals, oil, infrastructure
International Nuclear Safety Center Interactive Web Maps - Interactive maps provided by the International Nuclear Safety Center. Beginning with the world map you can drill down to continents and countries. Clicking on a nuclear facility at any level provides access to specific database information. You can also view all of the interactive maps one a single page and begin your investigation there.
hurricanes making landfall in U.S.
Sunday, January 24, 2010
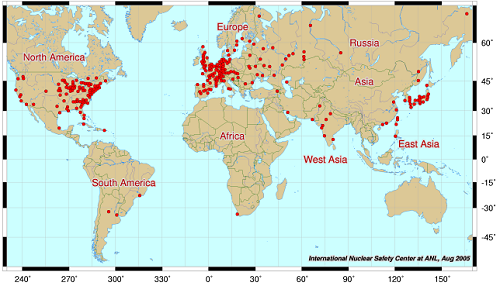
International Nuclear Safety Center Interactive Web Maps
Interactive maps provided by the International Nuclear Safety Center. Beginning with the world map you can drill down to continents and countries. Clicking on a nuclear facility at any level provides access to specific database information. You can also view all of the interactive maps one a single page and begin your investigation there.
View the nuclear safety web maps and data
View the nuclear safety web maps and data
Thursday, January 14, 2010
Added Free Climate Change Related ArcGIS Shapefiles
Added Free Climate Change Related ArcGIS Shapefile map layers. If you are new to GIS and would like to learn more and make your own maps, there are links here to free GIS programs and a free tutorial.
Check out the Climate Shift shapefiles
Check out the Climate Shift shapefiles
Tuesday, January 12, 2010
New & Improved ClimateShift.com
ClimateShift.com has been online in various forms since 2004. Most recently the ClimateShift.com was redirected to a directory on a sister website, MapCruzin.com. The unfortunate result of this was that, over time, many of the links to climate change, global warming and climate shift news, maps, data, research, impacts, renewal, war & security, skeptics, energy, resources, extreme weather, injustice videos, and Google Earth & Maps mashups became buried. So, we decided that it was time
ClimateShift.com stood on its own.
Please bear with us as we re-format and update many of the pages and links and add new material. Updates are posted on the Climate Shift Blog on a regular basis. You can also follow us on Twitter.
ClimateShift.com stood on its own.
Please bear with us as we re-format and update many of the pages and links and add new material. Updates are posted on the Climate Shift Blog on a regular basis. You can also follow us on Twitter.
Subscribe to:
Posts (Atom)
