Tuesday, October 3, 2017
Governments Are Failing to Protect Us On Climate Change
It's about time for governments to step up and take real action.
Tuesday, September 9, 2014
Watch Climate Change Movie DISRUPTION
Hello - You can watch the recently released 1 hour climate change movie DISRUPTION.
Monday, October 29, 2012
Will Climate Change Driven Superstorms Like Sandy Lead to Fukushima-Like Nuclear Disasters in the U.S?
Hurricane Sandy is bearing down on the east coast and it has the potential to become a superstorm. Will climate change driven superstorms like this bring floods and runoff beyond the capacity of U.S. nuclear energy power plants and result in disasters similar to what happened at Fukushima?
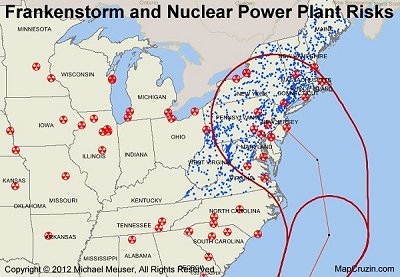
Learn More Here and download GIS shapefiles to create your own maps.
Wednesday, September 5, 2012
Temperature Rising Fast, Hottest Summer on Record, Arctic Ice disappearing - Reason for Hope?
11 degrees fahrenheit increase by the end of the century, hottest summer on record, west nile virus on the increase, arctic ice disappearing. All extremely dismal and downright scary. It's difficult to imagine the world my granchildren will live in as adults, if they can live in it at all.
In the The Six Stages of Climate Grief. Daphne Wysham says.
"We are surpassing all of scientists' worst-case scenarios by a long shot — we are now on track to an 11-degree Fahrenheit rise by the end of the century, according to the International Energy Agency. We've broken over 4,000 temperature records in the United States just this year, and scientists tell us record droughts, floods, storms, and forest fires all may become 'the new normal.'"
But, Daphne finds hope in working together and "doing the work." She says,
"After years of working through these stages, I've discovered a new sixth stage: doing The Work. This means taking courage from each other as we look this monster in the eye and fight side-by-side in the battle of a lifetime. Systemic change — not just light-bulb change — is what's required now. This must include everything from replacing the GDP as an outdated measure of progress to getting schools to teach climate science and arm the next generation with the facts."
Saturday, July 23, 2011
Time Lapse Video Map of U.S. July 2011 Heatwave Created by NASA
NASA (National Aeronautics and Space Administration) created this great time-lapse map video of the U.S. July 2011 heatwave.

View the NASA heatwave maps here
View the NASA heatwave maps here
Friday, July 22, 2011
Al GORE'S CLIMATE REALITY PROJECT - SOLVING THE CLIMATE CRISIS
Climate change is not your fault for the car you drive, the lights you turn on, or the food you eat. The climate crisis is our problem. Real solutions, systemic solutions, innovative solutions, can only come when we address it together. That’s what The Climate Reality Project will do. Without doubt. Without delay. And with your help.
The Climate Reality Project is bringing the facts about the climate crisis into the mainstream and engaging the public in conversation about how to solve it. We help citizens around the world discover the truth and take meaningful steps to bring about change.
Founded and chaired by Al Gore, Nobel Laureate and former Vice President of the United States, The Climate Reality Project has more than 5 million members and supporters worldwide. It is guided by one simple truth: The climate crisis is real and we know how to solve it.
Check out the Climate Reality Project Here
Friday, July 1, 2011
Explore Global Warming and Climate Shift Hot Spots Around the Globe
Climate Hot Map lets you explore and investigate global warming and climate change hot spots around the globe. Explore Climate Change Hot Spots Now.
Subscribe to:
Posts (Atom)
